Population
by Alfred W. Stuart
Professor Emeritus of Geography, University of North Carolina at Charlotte, 2010.
Reprinted with permission from The North Carolina Atlas Revisited. Managing editor: Alfred W. Stuart.
See also: Demography
Part 8: Net Migration Distribution
Figures 9a and 9b show the distribution within the state of net migration for the 1990-2000 and 2000-2004 periods, respectively. These maps show a remarkable change during the most recent period. Figure 9a displays the expected strong movement into metro areas, especially into Charlotte and Raleigh. Note, for example, that no fewer than 280,888 more moved in to than left Wake and Mecklenburg between 1990 and 2000, together accounting for over 28% of the state total. Large shares also went into counties suburban to those cities, including Johnston and Union. Out-migration was limited to just eight counties, mostly in the northeastern sector. Far and away the largest losses through out-migration, over 10,000 in both cases, were attributed to the counties containing the state’s largest military bases, Cumberland and Onslow.
In Figure 9b, displaying the 2000-2004 trends, the urban shift remains apparent. What is different is that 22 counties are estimated to have lost more people than they gained through migration. This is a major and perhaps prophetic shift from the total of eight that was recorded in the previous decade. That more areas experienced net out-migration than had population losses is explained by the fact that in some cases the excess of births over deaths (natural increase) was sufficient to offset losses due to out-migration. However, out-migration, even if the total population increases, usually involves younger and more capable people who leave in an attempt to find better opportunities elsewhere, including college students who typically do not return after graduation. Left behind are the elderly and the less capable. This “negative selectivity” generates a downward spiral that feeds on itself as people leave, stores close, tax revenues shrink and the place becomes less attractive to new businesses. The loss of tax revenues, in turn, hampers the ability of local governments to provide public services such as health care, clean water, waste disposal, education and roads. As these infrastructure elements decline in quality it then become further difficult to attract the economic development that is needed to break the downward spiral that these places are experiencing.
Again, the largest losses through out-migration were associated with places that have large military facilities in them, notably Cumberland and Onslow Counties. Otherwise, the losses through out-migration were predictably clustered in the northeastern part of the state, where it was previously shown that populations declined. In addition, a cluster in the southeastern quarter of the state also lost people, presumably associated with the loss there of textile and apparel factory jobs. The net out-migration from Burke County is probably associated with a decline in jobs in its furniture factories. The net out-migrations from Montgomery, Robeson, Vance, and Watauga counties totaled less than 500 each.
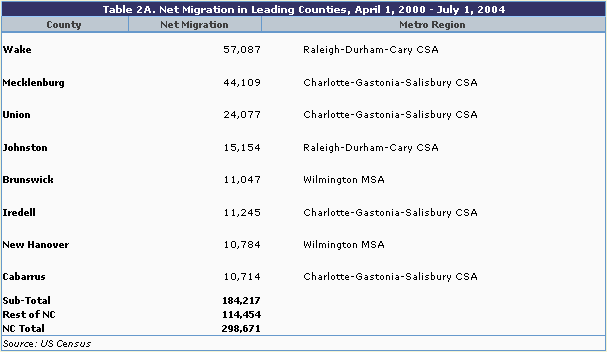
Table 2a shows the net migration for the 2000-2004 period for all of the counties that had 10,000 or more net in-migrants during that time. Note that all 8 are parts of larger urban regions. Two are in the Raleigh-Durham-Cary Combined Statistical Area (CSA) and four are parts of the Charlotte-Gastonia-Salisbury CSA. Together these 8 counties accounted for almost 62% of the state’s total in-migration. Another 70 counties had smaller amounts of in-migration and, as noted previously, 22 recorded net out-migration.
The US Internal Revenue Service used changes of addresses on income tax forms to estimate inter-county population migration patterns between 2000 and 2005. A sample of their data for the state's two most populous counties, Mecklenburg and Wake, as reported by the Charlotte Observer, is contained in Table 2b. It shows the leading out-of-state sources of migrants into those two counties and the counter flows from the leading them to those other places. In both cases, both North Carolina counties recorded a substantial net gain. The Raleigh area drew heavily from northern Virginia and several California areas whereas Charlotte in-migrants came more heavily from around New York City. These variations may reflect local variations in regional economies, with Charlotte's strength as a financial center and Raleigh's emphasis on high-tech industries.
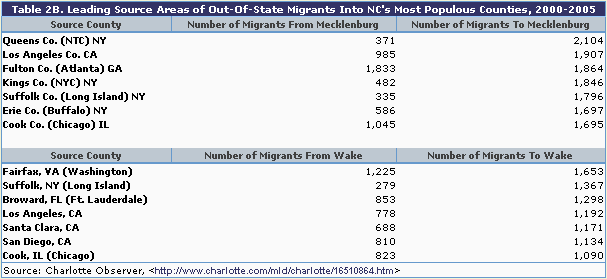
The primary reasons given by a sample of some of these in-migrants for their relocation decisions included North Carolina's strong economy (jobs), more reasonable costs of living, a more moderate climate, and the fact that so many friends and relatives have already moved here. Several former residents of Long Island reported that North Carolina has become something of a "buzz word" among many residents in the New York area.
Keep reading >> Population- Part 9: Age Structure ![]()
1 January 2010 | Stuart, Alfred W.