Population
by Alfred W. Stuart
Professor Emeritus of Geography, University of North Carolina at Charlotte, 2010.
Reprinted with permission from The North Carolina Atlas Revisited. Managing editor: Alfred W. Stuart.
See also: Demography
Part 6: Urbanization
 After the 2000 Census, the U.S. Office of Management and Budget revised previous definitions of metropolitan areas that are used in Federal statistical reports and elsewhere (Figures 6a-c). The original Metropolitan Statistical Areas (MSA) have been replaced by a two-tier system. One includes more narrowly defined MSAs, resulting in the break up of several of them in North Carolina. For example, the previous one Greensboro/Winston-Salem/High Point MSA has been broken into three MSAs: Greensboro-High Point, Winston-Salem, and Burlington. Similarly, the Raleigh-Durham MSA has been split into the Durham and the Raleigh-Cary MSAs. In other cases, the Charlotte-Gastonia-Rock Hill, NC-NC MSA lost Rowan and Lincoln Counties and gained Anson. Asheville added Haywood and Henderson Counties and Wilmington gained Pender County. The net result of these changes is that the number of MSAs increased from 12 to 15 and the number of counties in an MSA increased from 37 to 39.
The reasons for changing the previous composition of MSAs in North Carolina are not clear. As before, the delineation of an MSA starts with identifying a county that contains a core urban area with a population of at least 50,000 residents. Other counties may be attached to this urban core if the level of commuting between them and the core represent at least 25 percent of the labor force.
The second and new layer in the first tier are Micropolitan Statistical Areas. (Figure 6c). They are non-MSA counties with at least one urban cluster of between 10,000 and 50,000 population, plus any adjacent counties that have “a high degree of social and economic integration with the core as measured by commuting data.” Again the requisite level of commuting is usually 25 percent of the labor force. Of the 27 Micropolitan Areas identified in North Carolina, only three (Elizabeth City, New Bern, and Roanoke Rapids) include more than one county. All told, the Micropolitan Areas include 31 counties. This leaves 30 counties that are classified as neither MSA nor Micropolitan. This new system replaces the previous designation of counties being either “metro” or “non-metro,” in which case non-metro was often made synonymous with “rural.” Now the 30 counties that do not fall into either the MSA or Micropolitan categories can more accurately be designated as rural.
The second tier introduced after the 2000 Census is the Combined Statistical Area, a second definition of metropolitan areas. There are only five of these larger areas recognized in North Carolina. Four involve the state’s four most populous urban regions: Asheville, Charlotte, Greensboro/Winston-Salem and Raleigh/Durham. These are formed out of six of the MSAs, plus some of the adjacent Micropolitan Areas. An exception to the MSA inclusion in these Combined Statistical Areas is the Lumberton-Laurinburg Combined Area, which consists entirely of two adjacent Micropolitan Area counties. On the other hand, the remaining nine MSAs are not included in this new metropolitan area category, even though most are more populous than the Lumberton-Laurinburg area.
These newly defined MSAs dominated statewide growth in the 2000-2007 period, accounting for almost 90 percent of the state’s net increase. Leaders among the MSAs (Figure 6b and Table 1a) were Raleigh-Cary (+31.4%), Wilmington (23.3%), and Charlotte-Gastonia-Concord (NC part, +26.5%). By 2007 the MSAs contained over 70 percent of the state’s population. They grew by 16.7 percent between 2000 and 2007, more than the statewide growth of 12.6 percent. By contrast, the Micropolitan Areas grew more slowly, 6.6 percent, less than the statewide growth rate. They accounted for 12.2 percent of the state’s growth between 2000 and 2007 and in that later year they contained just under 22 percent of the North Carolina population. Despite the overall vigorous statewide growth, the remaining 30 predominantly rural counties saw their populations actually decrease by over 18,500. Their share of the state total dropped from 9.2 percent in 2000 to less than 8 percent in 2007.
The state's 5 Combined Statistical Areas (CSAs) accounted for nearly 61 percent of its total population in 2007 and 81 percent of the net gain between 2000 and 2007. Most of this was attributable to the Charlotte-Gastonia-Salisbury and Raleigh-Durham-Cary CSAs, which collectively contained nearly 40 percent of the state's population in 2007. Further, they combined for over 66 percent of the state's total growth in the seven year period.
These figures indicate that North Carolina is continuing to become a more urban state, much like the rest of the nation. The only exception to this trend is seen in some coastal and mountain counties, such as Brunswick and Macon. These counties have attracted numerous tourists and retirees to their environmental assets, causing their growth rates to exceed the statewide averages. Otherwise, this statistics strongly indicate North Carolina's future will be an urban future.
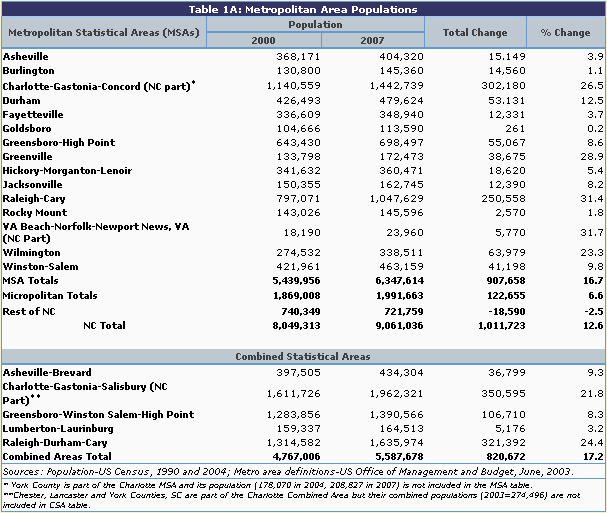
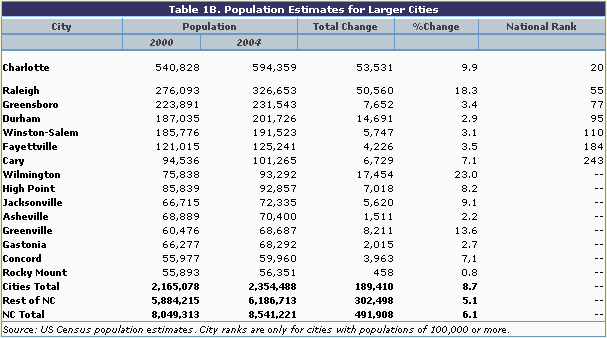
Table 1b summarizes US Census population estimates for those North Carolina cities that had populations of at least 50,000 people in 2004. Charlotte ranked 20th largest among US cities while Raleigh ranked 55th. Both cities, along with Greensboro and Durham, ranked among the 100 largest in the US. Charlotte, Raleigh, Cary, High Point, Wilmington, Greenville, Jacksonville, and Concord each had growth rates that exceeded the statewide increase of 6.1 percent, led by Wilmington’s jump of 23 percent. However, Charlotte and the Raleigh together had an estimated increase of 104,091 people, more than all of the remaining 13 cities combined. These 15 cities contained 27.6 percent of the state’s total population in 2004. As a group, they grew by 8.7 percent between 2000 and 2004, in contrast with the rest of the state's growth rate of 5.1 percent.
It should be noted that some of the population growth of these cities is more apparent than real. Part of it was due to an expansion of the corporate limits through annexation. North Carolina has relatively liberal enabling legislation that allows cities to rather easily annex adjacent areas that meet minimal density requirements. For example, the NC State Demographer has estimated that between 2000 and 2003, the state's four largest cities collectively grew by a total of 116,428 residents. Fully 63,733 of this growth (54.7%) was through annexation during the three year period.
Small towns
 Small towns are a common feature in North Carolina. In 1990 there were 455 of them with populations of less than 5,000. As noted in the Manufacturing entry, it seems that state policy for decades has emphasized trying to direct a large share of economic development to them through the use of financial incentives and other means. An example of this occurred in 1978 (October 13) when the NC Department of Commerce placed a two-page, centerfold advertisement in the Wall Street Journal that touted the business appeal of “Communities where Main Street is four blocks long. Trees outnumber people. And the County fair is the big event. Large companies like these quiet places. They’re uncongested and liveable.” About the only mention of cities in the ad was a comment about how small they are.
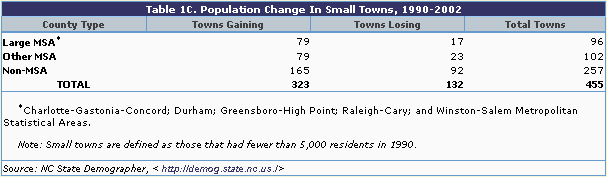
However, despite these efforts, the state’s small towns are not sharing in the general growth of the state. Virtually the only “big companies” that were attracted to them were labor-intensive, low-wage employers and they are now going out of business or leaving the state. As shown in Table 1c nearly 30% of the towns with less than 5,000 residents lost population between 1990 and 2002, a period in which the state generally experienced very strong growth.
These losses were not distributed evenly among the various types of counties because the context in which these towns were located was a critical determinant of whether or not they grew. For example, over 82% of the small towns located within one of the state’s five largest MSAs gained population. Obviously, most of the growing towns in them have become bedroom communities for their burgeoning metro areas. Striking examples of this are Mecklenburg County’s town of Huntersville, whose population grew nine-fold during the 12-year period, and the Wake County town of Apex, which saw its population quadruple during the same time.
These high growth rates for towns within larger metro areas are symptomatic of urban sprawl in the state. The sprawling growth of suburban areas is largely responsible for the fact that, between 1997 and 2002, North Carolina lost almost a half million acres of farmland. Currently, land use is increasing four times faster than the rate of population growth.. This illustrates the inefficiency of urban sprawl as more and more land goes toward low-density housing subdivisions, streets, golf courses, strip malls and other related developments. Some areas are attempting to control this sprawling growth by imposing more stringent controls on new subdivision approvals.
Another measure of sprawl is provided by estimates of net population migration between April, 2000 and July, 2004. These provisional estimates were prepared by the NC State Demographer. They show that five suburban counties had net in-migrations of 10,000 or more residents. Three were in the Charlotte area: Cabarrus, Iredell, and Union (the leader with 21,891). The others are Johnston, suburban to Raleigh, and Brunswick, adjacent to Wilmington.
The proportion of towns that experienced growth was about 78% in the smaller MSAs and 64% in the non-MSA counties. However, there was an important variation among the non-MSA counties. Those that are major recreational or retirement destinations experienced substantial growth in their small towns. For examples, Dare County, site of the Outer Banks and Moore County, site of the Pinehurst and Southern Pines retirement communities, together had 15 small towns and all of them gained and none lost population. Similarly, six western counties (Ashe, Avery, Jackson, Mitchell, Watauga, and Yancey) collectively had 16 growing towns and only 3 that declined. When the total for these eight counties is subtracted from that for all non-MSA counties, the result is 134 towns that grew and 89 that lost, a loss proportion of 40% in the remaining counties.
Four rural counties in the northeastern sector of the state, inland from the coastal beaches, illustrate this trend. Halifax, Hertford, Martin, and Northampton counties together have 29 small towns and in the 1990-2002 period nearly 80% of them saw their populations decline.
It seems clear that the state’s future is increasingly an urban future. Most small towns will continue to exist, of course, especially those that are within metro areas or those which contain environmental and historic attractions for retirees and visitors.
Estimates released by the US Census Bureau in June, 2004 show that there were 436 towns in North Carolina that had populations of less than 5,000 in 2003. The decline in the previously reported number of these small towns is due principally to the fact that several dozen of them, almost all in metro areas, have grown to have more than 5,000 residents since 1990.
A bare majority (224) of these small towns were part of an MSA while the remaining 212 were not. Of the total of small towns, some 212 (49%) lost population between 2000 and 2003. As before, only 37% of those that were within an MSA lost people while the majority (56%) that were not in an MSA saw their populations decline during this most recent period. All together, non-metro areas accounted for 70% of the towns that experienced population declines.
Thus, it appears that the tendency for most of the small towns in metro areas to grow continued into the first years of the 21st century. On the other hand, losses by towns in the more rural parts of the state have accelerated, even though some continued to attract new residents to their beaches or mountain valleys.
These losses were not distributed evenly among the various types of counties because the context in which these towns were located was a critical determinant of whether or not they grew. For example, over 82% of the small towns located within one of the state’s five largest MSAs gained population. Striking examples of this are Mecklenburg County’s town of Huntersville, whose population grew nine-fold during the 12-year period, and the Wake County town of Apex, which saw its population quadruple during the same time.
These high growth rates for towns within larger metro areas are symptomatic of urban sprawl in the state. The sprawling growth of suburban areas is largely responsible for the fact that, between 1997 and 2002, North Carolina lost almost a half million acres of farmland. Currently, land use is increasing four times faster than the rate of population growth.. This illustrates the inefficiency of urban sprawl as more and more land goes toward low-density housing subdivisions, streets, golf courses, strip malls and other related developments. Some areas are attempting to control this sprawling growth by imposing more stringent controls on new subdivision approvals.
Another measure of sprawl is provided by estimates of net population migration between April, 2000 and July, 2004. These provisional estimates were prepared by the NC State Demographer. They show that five suburban counties had net in-migrations of 10,000 or more residents. Three ware in the Charlotte area: Cabarrus, Iredell, and Union (the leader with 21,891). The others are Johnston, suburban to Raleigh, and Brunswick, adjacent to Wilmington.
The proportion of towns that experienced growth was about 78% in the smaller MSAs and 64% in the non-MSA counties. However, there was an important variation among the non-MSA counties. Those that are major recreational or retirement destinations experienced substantial growth in their small towns. For examples, Dare County, site of the Outer Banks and Moore County, site of the Pinehurst and Southern Pines retirement communities, together had 15 small towns and all of them gained and none lost population. Similarly, six western counties (Ashe, Avery, Jackson, Mitchell, Watauga, and Yancey) collectively had 16 growing towns and only 3 that declined. When the total for these eight counties is subtracted from that for all non-MSA counties, the result is 134 towns that grew and 89 that lost, a loss proportion of 40% in the remaining counties.
Four rural counties in the northeastern sector of the state, inland from the coastal beaches, illustrate this trend. Halifax, Hertford, Martin, and Northampton counties together have 29 small towns and in the 1990-2002 period nearly 80% of them saw their populations decline.
It seems clear that the state’s future is increasingly an urban future. Most small towns will continue to exist, of course, especially those that are within metro areas or those which contain environmental and historic attractions for retirees and visitors. But it seems that the state would do better to help them remain livable places for those who choose to remain in them by improving health care and education, rather than spending millions of dollars on vain attempts to lure businesses to them.
More recently, estimates released by the US Census in June, 2004 show that there were 436 towns in North Carolina that had populations of less than 5,000 in 2003. The decline in the previously reported number of these small towns is due principally to the fact that several dozen of them, almost all in metro areas, have grown to have more than 5,000 residents since 1990.
A bare majority (224) of these small towns were part of an MSA while the remaining 212 were not. Of the total of small towns, some 212 (49%) lost population between 2000 and 2003. As before, only 37% of those that were within an MSA lost people while the majority (56%) that were not in an MSA saw their populations decline during this most recent period. All together, non-metro areas accounted for 70% of the towns that experienced population declines.
Thus, it appears that the tendency for most of the small towns in metro areas to grow continued into the first years of the 21st century. On the other hand, losses by towns in the more rural parts of the state have accelerated, even though some continued to attract new residents to their beaches or mountain valleys.
Figure 7 portrays the proportion of each county's population that resided within an incorporated municipality in 2001. This figure exceeded 80 percent only in Durham and Mecklenburg counties. Proportions of 60 to 80 percent were common on the Piedmont, as well as on a large area of the Coastal Plain. The difference is, of course, that the cities on the Piedmont include the state's largest while the east is characterized by a greater number of smaller places.
The proportion of the statewide population that resides within one of the state's 543 active municipalities is about 51 percent, far less than the 80 percent residing within metro areas. This apparent contradiction is due to the fact that metro areas are comprised of entire counties, which typically include large unincorporated areas as well as one or more towns and cities.
Keep reading >> Population- Part 7: Total population ![]()
1 January 2010 | Stuart, Alfred W.