Population
by Alfred W. Stuart
Professor Emeritus of Geography, University of North Carolina at Charlotte, 2010.
Reprinted with permission from The North Carolina Atlas Revisited. Managing editor: Alfred W. Stuart.
See also: Demography
Part 3: Net Migration
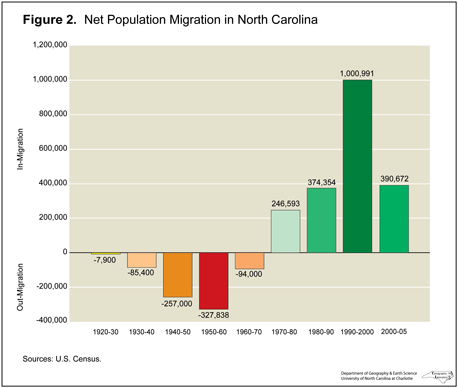 The most dynamic element of population change is net migration, the difference between the number of people moving into the state and the number who left. As Figure 2 indicates, in the past the state tended to lose more people this way than it gained. The heaviest losses were experienced in the 1950s but by the 1970s, for the first time in modern history, a substantial net in-migration was recorded. This continued to increase rapidly in more recent years. reaching nearly 1.4 million between 1990 and 2005.
The implications of this flood of new residents are profound. Historically, most North Carolina residents were natives, almost entirely either white or black. Now, thousands of new residents are from various parts of the country and from over seas. They bring with them different names, languages, ideologies, skin colors and cuisines.
The US Census shows that North Carolina ranked third nationally in terms of net domestic migration between 1995 and 2000 for the population that was 5 years or older in 2000. Only Florida and Georgia exceeded the state’s net influx of 337,883 people during the five-year period. These data do not include migration to or from international sites. These numbers are based on Census reports of changes in residence between 1995 and 2000 for the population that was alive in 1995. They do not compare with the preceding data, which include all people and a longer time period. The primary insight that they offer is that they include information on the state-to-state movements of people during the five-year period. The net in-migration of 337,883 people into North Carolina is the difference between the total domestic in-migration of 919,336 (5th largest among US states) and the out-migration of 581,453 (11th largest among US states) to other states.
New York was the leading source of in-migrants to North Carolina, with a net influx of 80,465 people. It was followed by Florida, with a net in-migration of 38,691. Six other states each contributed 10,000 or more: California, Maryland, New Jersey, Ohio, Pennsylvania, and Virginia. Of these eight stares, only Florida and Virginia recorded overall net in-migration flows while the other six lost more than they gained. These data make it apparent that North Carolina has become a magnet for people from many parts of the country.
The Census migration data also showed that North Carolina ranked first nationally in terms of the rate of increase in its foreign-born population, with a 274 percent jump between 1995 and 2000. All told, a net of 139,381 foreign-born people moved into the state from abroad and another 44,358 moved in from a different state. These domestic foreign-born in-migrants came mostly from the major "Gateway" states, California, New York, Florida, and Texas, led by the influx of over 16,000 from California. Most of these in-migrants came from Mexico, followed by a smaller number of Asians. Only a little more than a quarter of these new foreign-born residents have become US citizens, the lowest proportion among all of the states. Apparently this low proportion is a reflection of the recency of their arrival in North Carolina, coupled with the length of time that the naturalization process takes.
The 1995-2000 values show that 196,337 people 5 years or older moved into North Carolina from overseas, the ninth largest total among US states. Over one-quarter of the statewide total arrived in Mecklenburg and Wake counties while most of the rest went to other metro areas, especially Cumberland, Durham, and Guilford counties.
Keep reading >> Population- Part 4: Change Components ![]()
1 January 2010 | Stuart, Alfred W.