Transportation Part iii: Highway Use - Public Transportation
by Edwin W. Hauser, J. Dennis Rash, Sherry M. Elmes, and Nicholas J. Swartz, 2005.
Reprinted with permission from The North Carolina Atlas Revisited. Managing editor: Alfred W. Stuart.
Updated by Kurt Brenneman, Government & Heritage Library, 2011.
Transportation topics: Introduction | Highway use | Public transportation | Highway conditions | Water transportation | Air and rail travel | Projected future innovations
North Carolina currently has six types of public transportation systems: human service transportation, community transportation, urban transit, regional transit, vanpool and carpool programs, and intercity buses. A seventh “public” mode of conveyance includes taxis and other “for hire” personal vehicles, such as limousines. Taxi companies are regulated by business licenses granted by the communities in which they operate. Taxi service is available in most North Carolina towns and cities with more than populations of more than 25,000. The six modes of public transportation are described below.
Human Service Transportation
Human service agencies in every county provide some type of service to their clients to transport them to medical, educational, employment, or recreational facilities. Users of such services must be referred by human service agencies. There are currently 55 human service transportation systems operating in North Carolina and they are organized in one of three ways: (1) consolidated systems providing a single transportation program that uses its own vehicles and drivers; (2) consolidated systems contracting for transportation services; and (3) coordinated systems where two or more social service agencies serve their clients through one agency to optimize transportation resources and efficiency. In addition to these multipurpose transportation services, North Carolina as a state owns 13,878 public school buses, making it one of the largest single bus fleets in the nation. The North Carolina Department of Public Instruction purchases new equipment for all 115 school districts in the state, with counties being responsible for purchasing replacement buses.
Community Transit Associations
Community transit associations provide transportation for human service agency clients and the general public by subscription rides, prearranged by an individual, group, or human service agency. There are 80 community transit systems in North Carolina that operate as either single-county or multi-county systems.
Urban Transit
Urban transit systems provide fixed-route and, in some cases, dial-a-ride or “demand responsive” services. In 2009, there are 22 urban transit systems in North Carolina: Asheville, Boone, Cary, Chapel Hill, Charlotte, Concord/Kannapolis, Durham, Fayetteville, Gastonia, Goldsboro, Greensboro, Greenville, Hendersonville, Hickory, High Point, Jacksonville, Raleigh, Rocky Mount, Salisbury, Wilmington, Wilson, and Winston-Salem. Statistics for those urban systems that accommodate more than two million bus riders annually are shown in Table 5.
|
Table 5. Ridership on Six Largest Bus Transit Systems in NC, 2009
|
||||
|
Transit Agency
|
Population of Service Area
|
Type Vehicle(s) Operated
|
Annual Passenger Boardings
|
Annual Passenger
Miles |
|
Charlotte Area Transit System
|
758,927
|
Fixed route bus
Demand response
|
25,329,765
|
136,276,093
|
|
Chapel Hill Transit
|
71,069
|
Fixed route
Demand response
|
7,288,256
|
16,454,774
|
|
Capital Area Transit
|
347,729
|
Fixed route
Demand response
|
5,339,216
|
23,028,693
|
|
Durham Area Transit Authority
|
187,000
|
Fixed route
Demand response
|
5,281,468
|
21,245,667
|
|
Greensboro Transit Authority
|
235,262
|
Fixed route Demand response
|
4,044,820
|
16,323,140
|
|
Winston-Salem Transit Authority
|
199,555
|
Fixed route
Demand response
|
3,089,575
|
6,814,496
|
|
Sources: 2009 Annual Transit Profiles, National Transit Database, Federal Transit Administration; FY2009 Urban Transportation Operating and Financial Statistics, North Carolina Department of Transportation.
|
||||
Metropolitan Regional Transit
In 2011, two regional transit systems operate in North Carolina: the Research Triangle Regional Transit Authority, which operates as Triangle Transit (TTA), and the Piedmont Triad’s system, called the Piedmont Authority for Regional Transportation (PART). TTA operates fixed route bus service within the Research Triangle metropolitan area to connect Raleigh, Durham, Cary, Chapel Hill, and nearby suburbs with the Research Triangle Park and the Raleigh-Durham International Airport. PART provides at present extensive vanpool and express bus service in a seven-county region surrounding the core cities of Greensboro, Winston-Salem, and High Point. Both of these regional systems are involved in Federal Transit Administration (FTA) and NCDOT-sponsored studies and design work to investigate the feasibility and to develop specific plans for further regional transportation systems, including regional rail in the Research Triangle region. For example, in 2010 PART approved a Regional Transit Development Plan, the Piedmont Triad Regional Transit Vision for 2025. The Charlotte Area Transit System (CATS), although not at present a regional transit system, provides express bus service to and from counties adjacent to Mecklenburg County.
Carpool/Vanpool Services
In addition to carpool/vanpool services provided by the regional and urban transit systems, the NCDOT Central Office and various private vanpools and carpools across the state provide commuter services to employees. There are estimated to be almost 200 such informal systems in existence as of 2007.
Intercity Bus Services
Intercity bus services are privately owned and operated transportation systems. These systems serve many cities and towns throughout the state, with most routes concentrated in the densely populated corridor from Charlotte to Greensboro and Raleigh. Intercity bus companies currently registered and regulated by the North Carolina Utilities Commission are Greyhound Lines, Carolina Coach Company, and American Charters. These companies provide fixed route intercity and interstate bus service. In addition, major components of North Carolina’s bus/coach transportation services are provided by charter coach or tour companies, which are unregulated at the state level. With the aging of the population, and increasing demands for tourist travel by charter coach or tour companies, there is a growing demand for this type of service. Approximately 110 such private tour/coach companies, which are members of a national charter coach association, currently operate in North Carolina, although this only represents a portion of the companies providing these services. This is another transportation “growth industry” among the transportation services in North Carolina, fueled by the growing number of retired persons and others who prefer such services for tourism trips.
Commuting to Work
Since congestion in urban areas typically is most severe during morning and afternoon “peak hours,” the most widely used measurement of congestion in American cities is the average time taken on the trip to work. These data are collected in the U.S. Census Bureau’s American Community Survey and in the Decennial Population Census. In 2009, the Average Commute Time to work in North Carolina’s counties (in minutes) is shown in Figure 6. By analyzing commute times and patterns, it is possible to begin to examine the extent to which congestion has become more common in the larger urban areas. Commuting times are a function of the relative traffic density on the highway. Relative traffic density is the ratio of volume to road capacity.
Figure 6 portrays average commute times to work (in minutes) for North Carolina counties in the year 2009. A little more than half the State’s counties had an average commute time to work of between 20 and 30 minutes. Longer commute times (more than 30 minutes) were scattered around the state, including in some counties that are contiguous to major employment areas in adjacent counties. The northeastern part of the state also had high average commute times, the result of many residents commuting to Tidewater Virginia for employment. Lower commute times were experienced by residents in less urbanized counties in the mountains, the central Coastal Plain, and the Sandhills, as well as in the more highly urbanized counties in the northern Piedmont.
Figure 6. Average Commute Time to Work, 2009

Increased automobile ownership and continuation of the suburbanization of metropolitan areas have been partially responsible for changes in commuting patterns, with an increase from 1990 to 2000 in individuals driving alone to work. However, as compared to previous years (compare Figure 7 with Figure 8), the period from 2000 to 2009 saw a decline in the percentage of individuals driving to work alone, possibly because higher fuel prices caused commuters to carpool and/or use public transportation. In addition, more employers may have encouraged carpooling. In both 2000 and 2009, a larger percentage of individuals drove alone in the Piedmont and larger metro areas, which generally tend to be areas of higher income and auto ownership.
Figure 7. Drove Alone to Work, 2000
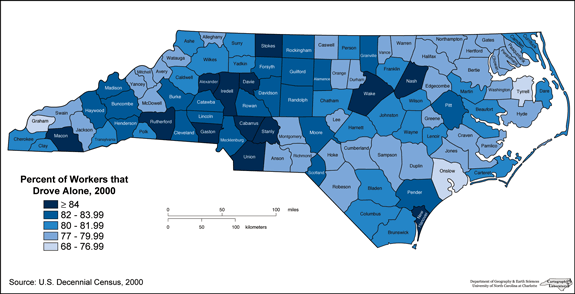

Figure 8. Drove to Work Alone, 2009

In comparison with the tendency of traveling alone to work occurring primarily in urban areas, carpooling is higher in rural, relatively isolated counties where incomes are usually lower (Figures 9 and 10). The lowest percentages of carpooling in both 2000 and 2009 were located in all of the state’s metro areas. Commuters who live farther from larger employment areas use carpools or vanpools to work, more than those who live closer to their employment.
Figure 9. Carpooled to Work, 2000

Figure 10. Carpooled to Work, 2009

As one would expect, the largest share of individuals using public transit as primary means to work, for both 2000 and 2009, were located within the state’s metro areas (Figures 11 and 12). In 2000, only four counties had more than 2.5 percent of their population using mass transit as their primary means to work: Mecklenburg, Orange, Durham, and Pasquotank. In 2009, only three counties had more than 2.5 percent of their population using mass transit as their primary means to work: Durham, Mecklenburg, and Orange. Orange County had the largest percentage at 6.5 percent. Fewer counties in 2009 compared to 2000 had more than 0.30 percent of their residents using transit as a means to work (50 counties in 2000 compared to 62 in 2000).
Figure 11. Public Transit to Work, 2000

Figure 12. Public Transit to Work, 2009

Truck/Freight Mobility
North Carolina is a major manufacturing and distribution center for the eastern U.S. It is geographically positioned to link the nation’s northeast and southeast, the historic center of population and manufacturing, and the emerging center for future growth and economic development. Latin American trade growth and shifts in routing of Asian trade are already affecting North Carolina’s freight transport system. For example, trade patterns are expected to shift when the Panama Canal expansion project is completed in 2014.
Other factors that are making an impact on freight movement, particularly truck freight, in North Carolina include:
- Increasing domestic and global trade, including from the North American Free Trade Agreement (NAFTA)
- Outsourcing to offshore areas for comparative economic advantage in production (though this may slow down if fuel prices remain high)
- Emergence of global trade blocs and city-state trade areas
- Far-flung intermodal supply chains and a supply chain paradigm of decreasing inventory through more frequent shipments
- Increasing freight traffic and congestion along trade corridors and at ports, airports, and interstate borders (weigh stations)
Figure 13 shows freight flows on North Carolina’s highways for 2007, the most recent date for which such systemwide data are available. It is no surprise that the heaviest volumes of heavy truck traffic (approximately 50,000 trucks per day) took place on the Interstate corridors through the Piedmont Crescent (Raleigh to Greensboro-Winston-Salem, on to Charlotte and southwest to the South Carolina border). As regulated carriers, there are approximately 272 trucking companies in North Carolina that report to the North Carolina Utilities Commission.
Figure 13. Freight Flows on North Carolinas Highways, 2007

11 April 2011 | Brenneman, Kurt; Elmes, Sherry M. ; Hauser, Edwin W.; Rash, J. Dennis; Swartz, Nicholas J.