North Carolina has the fastest growing Latino population in the country. According to the US Census, the Latino population in North Carolina has grown 394%, from 76,726 in 1990 to 378,963 in 2000. Latinos now make up 4.7% of the North Carolina population in comparison to 1.04% in 1990. Other sources estimate the population to be even larger, with numbers closer to 530,328 in 2002. In contrast, 12.5% of the US population is Latino. Census projections estimate that by 2050, Latinos will constitute roughly one fourth of the US population. Most Latinos migrate to the United States for economic pportunities.
Country of origin and citizenship
Most of the Latinos in North Carolina are of Mexican origin (65.1%). Puerto Ricans (who are US citizens) comprise 8.2% of the North Carolina Latino population, and Cubans or Cuban-Americans are 1.9%. The remaining 24.8% are from other Central or South American countries, or other Hispanic categories. In contrast, Latinos in the United States are a little less likely to come from Mexico (58.5%). They are slightly more likely to be from Puerto Rico (9.6%), or Cuba (3.5%). A little more than one quarter (28.4%) of Latinos nationally are from other countries.
Nearly two-thirds of the North Carolina Latino population are foreign-born (64.2%) (Table 2:1). Almost all of North Carolina's foreign-born Latinos are non-citizens (58.3%); only 5.9% have been naturalized. In contrast, a little less than half of Latinos nationally (45.1%) are foreign born. Of these, 13.6% have been naturalized, and 31.5% are non-citizens. People reside in the US under many immigration classifications. When we refer to "non-citizens" we are referring to those who have not been naturalized as US citizens. However, citizenship is not required to live in this country legally. Millions of foreign nationals currently live legally in the United States without citizenship. They may hold student, tourist, or special work visas (such as J-1, H-1A, H-1B, H-2A). Thousands of "non-citizens" serve in the US military. Many foreign nationals who live in this country for long periods of time never become naturalized citizens. Those that do become citizens may go through a process that can take years. As North Carolina has a more recent immigrant community, we have a larger proportion of non-citizens who are part of the population.
Presumably, because more of the Latinos in North Carolina are recent immigrants, they have greater language barriers than Latinos nationally. More than one third of the Latinos in North Carolina (34.0%) speak English poorly or not at all, and almost half of all Latinos in the state report not speaking English very well (Table 2:1). In comparison, 21.9% of Latinos nationally report being able to speak English poorly or not at all, and 36.3% report not speaking very well.
Table 2:1: North Carolina Latinos origin and language (2000)
|
North Carolina |
United States |
|
|---|---|---|
|
Source: US Census, 2000 Supplementary Survey Summary Tables PCT006, PCT020. |
||
|
Foreign born |
64.2% |
45.1% |
|
Non-citizens |
(58.3%) |
(31.5%) |
|
Naturalized |
(5.9%) |
(13.6%) |
|
Speak English poorly or not at all |
34.0% |
21.9% |
|
Speak English less than very well |
49.9% |
36.3% |
The Latino community is one of tremendous diversity. North Carolina Latinos come from many different geographic backgrounds. Some of them are united as an ethnic group by a common heritage derived from Spanish language and culture, while others share cultural heritages unique to their countries of origin. The commonalities and differences between Latin American subgroups are often debated; however, key traits that seem most often shared among Latinos include a connection with the Spanish language, strong family relationships and a strong family orientation. Recent Latino immigrants tend to have lower educational and occupational attainment compared to other Americans, and a strong connection with religion, particularly the Roman Catholic Church.
Key differences among the various Latino subgroups revolve around the circumstances of their immigration to the United States. Mexican Americans and Mexican nationals have the longest history in the United States, migrating most often due to economic considerations. Puerto Ricans, as citizens of the United States, have also had a long history of migration to the mainland, also coming most often for economic reasons. Better economic conditions in Puerto Rico have led to a more circular immigration pattern over the past two decades, with many Puerto Ricans returning to the island after immigrating to the United States. Cubans began coming to the United States in larger numbers after the Castro revolution. Unlike many migrations of Latinos to the United States, the migration of Cubans after the revolution included many upper class, highly educated Cubans seeking political asylum. Cuban Americans, as a result, tend to have higher educational attainment and socioeconomic status compared to other Latinos. Central and South Americans have the shortest history of migration to the United States, coming in the largest numbers during the last two decades as a result of civil and economic unrest in their countries.
Age
The growth of the North Carolina Latino population reflects both an increase in immigration and an increase in the number of Latino births. Latinos have a higher birth rate than do other population groups. The number of Latino births has increased more than seven-fold, from 1,752 in 1990 to 12,544 in 2000. Because of the recent immigration and high birth rates, North Carolina Latinos are younger than the general population. The median age of all people living in North Carolina is 35.3 years whereas the median age of Latinos is 24.
Nationally, the median age of Latinos is 25.8. Almost twice as many Latinos in North Carolina are under the age of five (12.1%) as compared to the North Carolina population in general (6.7%). Similarly, 20.9% of North Carolina Latinos are under the age of 10 compared to only 13.7% in the general population.
Gender
Initially, male Latinos were the most likely to immigrate to North Carolina to work. However, over the past few years, entire families have immigrated here, and some women have come alone to work in industries such as the seafood packing companies of the Coast. Nevertheless, the North Carolina Latino population continues to be disproportionately male. Almost three fifths (59.8%) of North Carolina Latinos are male, compared to 49% of the North Carolina population as a whole, or 51.4% of all Latinos across the nation.
Employment and Income
North Carolina Latino adults age 16 or older are more likely to be in the labor force (74.8%) and working or actively seeking work than are non-Latino whites or African Americans (Chart 2:1). North Carolina Latinos are also more likely to be employed (69.1%) than are other population groups in North Carolina, or than Latinos nationally.
Chart 2:1: Employment status for the North Carolina population 16 years and older (2000)
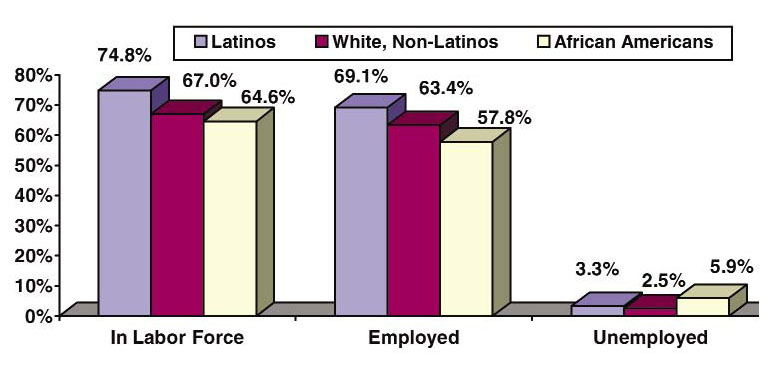
Source: US Census. Census 2000 Supplementary Survey Summary Tables (PCT048)
No longer composed mainly of migrant workers who come and go with the "picking" seasons, the Latino population is represented in most sectors, but tends to be concentrated in lower-paid, less-skilled jobs. They are far less likely to be employed in management or professional occupations, and more likely to be employed in farming, construction, production, or transportation occupations. More than one third of all Latinos are employed in production, transportation, and material-moving occupations; approximately one fourth are employed in the construction, extraction, and maintenance occupations (Chart 2:2).
Chart 2:2: Occupation for the employed civilian population 16 years and older (2000)
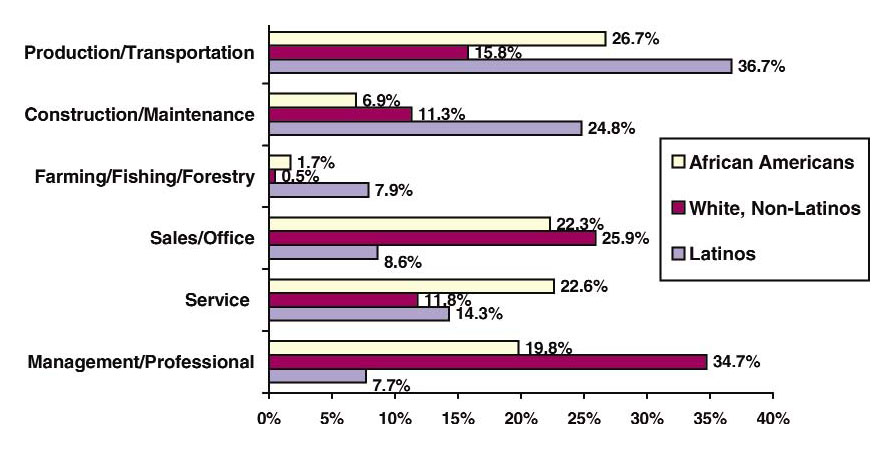
Source: US Census. Census 2000 Supplementary Survey Summary Tables (PCT049)
Almost one tenth of Latinos reported being employed in farming, fishing, or forestry in the 2000 Census. However, the actual number of Latinos employed in the agricultural industry is probably higher, as migrants who work in North Carolina may not be fully counted in North Carolina's Census numbers. North Carolina is the fifth most populous farmworker state in the US, behind California, Texas, Washington, and Florida. Some experts suggest that there are more than 100,000 migrant and seasonal farmworkers working in North Carolina throughout the year. Of these, approximately 60,000 are Latinos. In 2002, the NC Employment Security Commission (ESC) counted 108,900 migrant, seasonal, year-round and H-2A workers working in North Carolina fields. Taking into account the limitations of these estimates, and including dependents, NC's farmworker population is estimated to be over 200,000. The work of Latinos helps drive the state's economy. North Carolina's tobacco, greenhouse and nursery, vegetable and fruit industries rely heavily on the labor of farmworkers, producing more than $2.2 billion in sales.
Although Latinos are more likely to be employed than other racial or ethnic groups, they are also the most likely to live in poverty; i.e., they have family incomes below the federal poverty guidelines ($18,100/year for a family of four in 2002). While Latinos comprise only 4.7% of the state's population, they comprise 10.4% of all poor people in the state. More than one quarter of North Carolina Latinos live in poverty (27.4%), which is slightly higher than African Americans and much higher than non-Latino whites (Chart 2:3).
Chart 2:3: Percentage of North Carolina population that lives in poverty (2000)
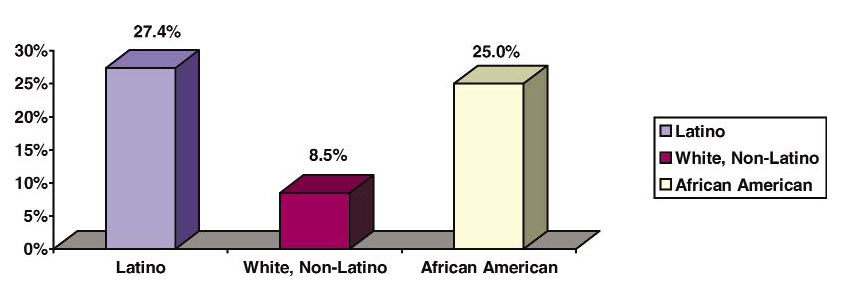
Source: US Census. Census 2000 Supplementary Survey Summary Tables. Poverty Status in the Past 12 Months by Age (P114, P115)
The median family income for Latinos in 1999 was $30,529 -- similar to that of African Americans ($31,951), but much less than that of non-Latino whites ($51,364). Approximately one out of every ten North Carolina Latino families (10.5%) had incomes less than $10,000 year, compared to 13.4% of African- American families, and 3.6% of non-Latino, white families. Approximately 30% of both North Carolina Latino (29.4%) and African-American (30.3%) families had incomes below $20,000/year, compared to only 11.5% of non-Latino, white families.
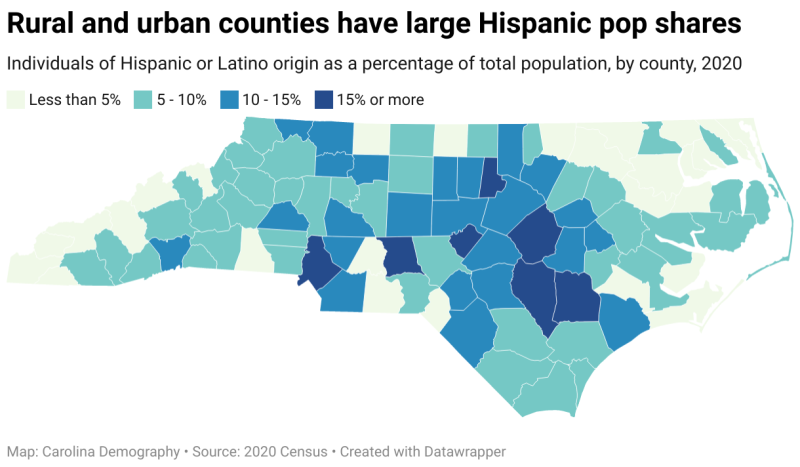
Latinos are present in all of North Carolina counties; however, they tend to be concentrated in the Eastern, metro, and military areas of the state (Map 2:1). The presence of Latinos in smaller counties is significant. Indeed, five counties in NC have a reported Latino population of 9% or higher; and another 14 counties have a Latino population of 6% or higher.
Map 2:1: North Carolina Latinos as a percent of total county population, 2000 (see above)
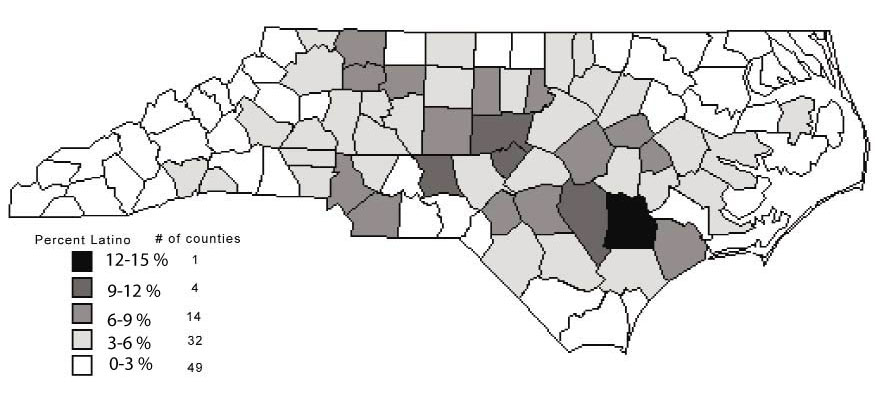
Source: US Census, 2000. Produced by the Cecil G. Sheps Center for Health Services Research, UNC-CH.