A large part of the national decline in manufacturing employment has been the result of a steady rise in productivity, primarily through the greater application of technology to production processes. This explains how output can rise even as employment falls. Since 1970, US manufacturing output has doubled, increasing by 50 percent since 1992 despite the current recession. On the other hand, manufacturing’s share of total employment nationally has fallen from one-third in the 1960’s to 12 percent today. A measure of productivity is provided by data on Gross State Product (GSP) with the latest data available on it from the US Bureau of Economic Analysis being for 2003. GSP is the measures of the total value of goods and services that are produced by the, economy. The previously mentioned national loss of 10 percent of factory jobs between 2000 and 2001 happened as GNP in manufacturing fell at the slower rate of just six percent, an indication that rising productivity required the employment of fewer workers.
Between 1997 and 2003 national GSP rose 33 percent while total employment increased by 7.4 percent. In manufacturing, employment fell 18 percent even as total employment in all sectors grew by nearly 8 percent.
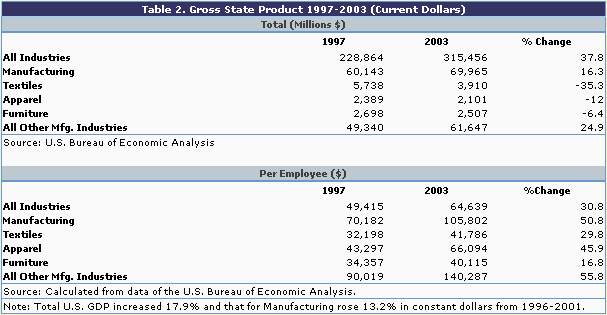
Despite jobs losses, the national manufacturing GNP rose 9.6 percent between 1997 and 2003, a likely indication of increasing productivity. However, North Carolina had a somewhat different experience. Total state GSP rose in part because total non-farm employment also rose, by 5.4 percent but also partly because of inflation. However, in manufacturing, North Carolina’s GSP rose by 16.3 percent even though it fell sharply in the several cloth industries. As Table 1 shows, jobs in manufacturing fell by over 29 percent during the 1990-2004 period. The fact that employment declined sharply while GSP rose is an indication that there was an increase in productivity, as measured by GSP per employee and Table 2(b) shows that this was precisely the case. Overall, GSP per employee in all sectors rose 31 percent and 50 percent in manufacturing. However, the fact is also that the three traditional industry groups, apparel, textiles and furniture, despite modest gains between 1997 and 2003, still had levels of productivity that were well below those for the balance of the manufacturing sector, less than half of those for all other manufacturing sectors. Thus, North Carolina’s job losses are a function of the combined effects of rising productivity and down turns in the less productive industries.
It is conventional wisdom to blame cheap foreign imports for manufacturing job losses when, in fact, it is rising productivity that accounts for much of these losses. Forgotten in the emotionally charged rhetoric that typically surrounds discussions of such issues is the fact that these imports are a benefit to American consumers. When consumers can buy cloth and clothing for less, this effectively increases their net incomes. The problem is that these benefits are diffused, available to millions of consumers throughout the country. On the other hand, the jobs losses are geographically concentrated, with thousands of textiles and apparel jobs losses confined to the Carolinas, as noted above.
Another statistical measure of economic output is known as Value Added, a number available only from the US Census. Value added is a dollar measure of output that takes places at particular locations. It excludes purchased materials, for example, but includes the contributions of labor and capital at a factory. In short, it’s a precise measure of what actually happens at a given factory location. Even though the 1997 Census of Manufactures reported that the Textiles, Apparel, and Furniture industries together accounted for over one-third of North Carolina's manufacturing employees in that year, those industries accounted for just 18.5 percent of the state's total value added by its factories. By 2001, the latest year for which this information is available, the share of value added that was attributed to these industry groups had fallen to just 13.3 percent of the state's total in manufacturing.
The labor-intensive nature of the textiles, apparel, and furniture industries is indicated by the proportion of their value added that is contributed by labor costs, total payrolls in this case. In 2001, payrolls accounted for 23.5 percent of value added in all manufacturing industries in North Carolina. However, in the two cloth and the furniture industry groups collectively nearly 44 percent of their value added was attributed to their payroll costs. That is, even though wages are low in these sectors, labor costs make up a relatively high share of their cost of doing business. This fact is what makes these industries so vulnerable to competition from foreign producers who pay much lower wages.
Another ominous aspect of these traditional industry groups is that they invest less in capital equipment and facilities. The Census reported that while North Carolina manufacturers, apart from the textiles-apparel-furniture industries, invested nearly $9,300 per employee in capital expenditures in 2001, the traditional industries together averaged spending not quite $3,700 per employee. This suggests that these industries are not acquiring the technologies that would allow them to increase their productivity in order to more effectively meet the competition from low labor cost foreign producers.
This GSP data also suggests that using employment trends as the sole measure of economic change can be misleading, in this case tending to overstate the apparent decline of manufacturing in the nation and the state. Unfortunately, however, GSP data are not available at the county level. In addition, changes in employment at the local level are probably the most meaningful measure for most individuals, as well as for economic development agencies. Furthermore, not only are employment statistics available at smaller geographic levels, they also tend to become available more quickly, thus giving a more current measure of change. For all these reasons, employment is the measure that is used in the remainder of this report.